The "length" of cotton fibres is a property of commercial value as the price is generally based on this character. To some extent it is true, as other factors being equal, longer cottons give better spinning performance than shorter ones. But the length of a cotton is an indefinite quantity, as the fibres, even in a small random bunch of a cotton, vary enormously in length.
Cotton is the shortest of the common textile fibers, hence, other things being equal, it makes the most irregular yarns and fabrics. Accordingly the market pays a premium for good length.
The various methods of measuring length may be classified according to whether they
- measure the staple length only, or other parameters
- work by aligning the fiber ends, e.g comb sorters,
- measure only length, or use the tuft for other measurements, such as strength etc
The importance of fiber length to textile processing is significant. Longer fibers produce stronger yarns by allowing fibers to twist around each other more times. Longer fibers can produce finer yarns to allow for more valuable end products. Longer fibers also enable higher spinning speeds by reducing the amount of twist necessary to produce yarn.
The variability in fiber length can be explained 70-80 percent by genetics , so variety selection is very important. Fiber elongation begins at bloom and continues for about 21 days. Moisture stress during the fiber elongation period will reduce fiber length in all varieties. Starting with a variety that has better genetic potential for fiber length will minimize the probability of producing fiber length in the discount range. Severe weathering after bolls have opened can reduce fiber length because more breakage can be expected in the ginning process. Besides variety, water management and maintaining good plant-water relations is probably the most important factor affecting fiber length
Length Uniformity and Short Fiber Content. Length uniformity is now part of the premium/discount valuation of cotton. Short fibers within a process mix of cotton cannot wrap around each other and contribute little or nothing to yarn strength. Short fibers are virtually uncontrolled in the manufacturing process, indirectly causing product defaults and directly contributing to higher waste and lower manufacturing efficiency.
Since short fiber content and length uniformity are derived from length, they are influenced by the same factors as length.. Length uniformity can be more influenced by environment than effective length because temperature is involved in the regulation of genes, which cause epidermal cells to differentiate into fibers. Crop management practices that influence where bolls are located on the plant can impact short fiber content levels. Uniform fruit retention patterns encourage better length uniformity. Disruption to the natural length distribution is most often caused by mechanical damage, so maintaining recommended moisture levels at the gin is important.
SHORT FIBER
The original theory of the fibrogram as developed by Hertel more than fifty years ago has served as the basis of all subsequent cotton length measurements. The major assumptions Hertel made in deriving the theory of the fibrogram are embodied in the statement "The fiber is to be selected at random and every point on every fiber is equally probable." This statement translates to:
- A sampled fiber is held at a random point along its length.
- The probability of sampling a particular fiber is proportional to its length.
Since the longer fibers have a greater probability of being sampled, this results in the length distribution in the fiber beard becoming biased toward the longer fibers.. Using Suter-Webb data and assuming uniform fiber fineness, it is possible to calculate the distributions for the length biased samples.
To investigate the validity of the second assumption, we measured the length distribution of a few fiber samples in their original forms and of fiber beards made from these samples. The selected samples for the experiment were two staple standard cotton samples (SS28 and SS40). Length measurements were performed on the samples in their original forms using standard Suter-Webb Array (SWA) methods and the Advanced Fiber Information System Length and Diameter module (AFIS-L/D) made by Zellweger Uster, Inc. In addition, the AFIS was used to measure the length distributions of fiber beards prepared using a model 192 fibrosampler with and without allowing the beards to pass over the carding section of the fibrosampler. All AFIS-L/D results are the averages of three repetitions with three thousands fibers were measured in each repetition. The experimental results along with the calculated results based on a length biased sample are listed in Table 1..
| Table I. Suter-Webb Array (SWA) and AFIS Length data. | |||||
| Sample: Staple Standard 28 | |||||
| SWA Raw | SWA Expected | AFIS Raw | AFIS Uncarded | AFIS Carded | |
| By Weight | |||||
| Mean Length in. | 1.19 | 1.27 | 1.10 | 1.09 | 1.08 |
| Length CV% | 29.9 | 23.7 | 32.7 | 31.5 | 29.9 |
| Short Fiber % | 14.2 | 6.6 | 13.6 | 13.6 | 13.3 |
| Upper Quartile in. | 0.92 | 0.96 | 0.89 | 0.89 | 0.88 |
| Mean Length in. | 0.63 | 0.75 | 0.64 | 0.64 | 0.65 |
| Length CV% | 44.7 | 29.9 | 43.1 | 41.8 | 39.3 |
| Short Fiber % | 31.6 | 14.2 | 28.7 | 28.3 | 26.7 |
| Upper Quartile in. | 0.84 | 0.92 | 0.81 | 0.81 | 0.81 |
| Sample: Staple Standard 40 | |||||
| SWA Raw | SWA Expected | AFIS Raw | AFIS Uncarded | AFIS Carded | |
| By Weight | |||||
| Mean Length in. | 1.19 | 1.27 | 1.10 | 1.09 | 1.08 |
| Length CV% | 25.7 | 19.5 | 31.2 | 31.4 | 31.2 |
| Short Fiber % | 4.0 | 1.1 | 4.6 | 4.9 | 4.6 |
| Upper Quartile in. | 1.41 | 1.44 | 1.31 | 1.31 | 1.3 |
| Mean Length in. | 1.0 | 1.2 | 0.9 | 0.9 | 0.9 |
| Length CV% | 44.0 | 25.7 | 40.3 | 40.3 | 38.9 |
| Short Fiber % | 17.3 | 4.0 | 14.0 | 14.3 | 13.0 |
| Upper Quartile in. | 1.34 | 1.41 | 1.22 | 1.21 | 1.19 |
A comparison of the Suter-Webb array data and the AFIS data for the raw stock show good agreement between the methods with small differences characteristic of this version of AFIS. Of more importance is a comparison of the AFIS data between the raw, uncarded and carded samples. The mean lengths and length distributions as indicated by the coefficient of variation are almost identical to those in their original forms. Even if some fiber damage occurs in the AFIS, the damage would be very similar for a given sample and allow us to detect differences in the samples due to the sampling or carding process. Since the differences of the length distributions and the calculated mean lengths between fiber beards and the original fiber samples are small, this would indicate that the second assumption should be modified such that each fiber in the original sample has equal probability to be caught in forming the fiber beard. This in turn would indicate fibers are sampled in clumps rather than individually. Thus the fibrogram theory derived by Hertel should not be applied to the fiber beards prepared from the fibrosampler. However, his theory appears to apply to those fiber beards prepared from sliver by using sliver clamp.
The short fiber algorithm as developed by Zellweger Uster is based on the assumption that the fibers are sampled in clumps and integrates the optical response of the fibers over the width of the lens. The first few length groups are estimated by the character of the fibrogram in the form of a quadratic since the HVI is not able to scan in front of the 0.150 in position. This allows us to calculate a complete fiber distribution from the fibrogram, This data is then treated as Suter-Webb data and various length parameters calculated including short fiber content.
The cotton set with which the short fiber algorithm was originally verified at Zellweger Uster includes international cottons collected by sales agents from around the world along with all available ICC cottons. This set of cottons was tested on two different AFIS instruments. Suter-Webb tests were performed at Zellweger Uster and at the University of Tennessee. The results are shown in figures 1.2 and 3.. The AFIS shows its usual excellent correlation (r=0.97) with Suter-Webb data. In addition, the short fiber value developed by the distribution calculated by the HVI using the new short fiber algorithm correlates well with both AFIS (r=0.93) and with Suter-Webb (r=0.94).
FIG 1
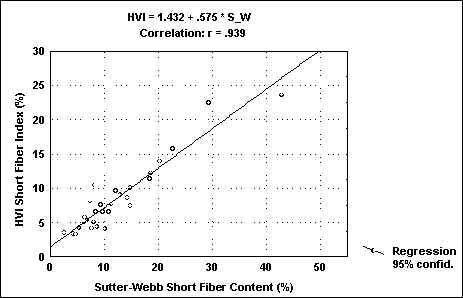
FIG.2
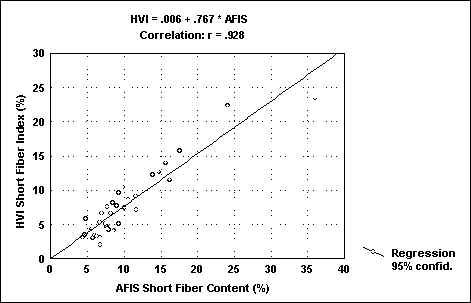
FIG.3
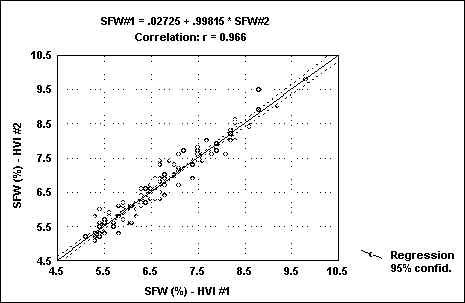
The USDA crop samples from 1990 to 1994 were obtained from Clemson and tested on three HVIs. The agreement between two of the HVIs is shown in figure 4 (r=0.97). As stated before, the entire fiber distribution is obtained. This allows us to calculate not only short fiber values but also other fiber length parameters such as the upper quartile length based on the complete fibrogram rather than a small section of the fibrogram. The relationship of the upper quartile length calculated from Suter-Webb data and the fibrogram is shown in figure 5 (r=0.90).
FIG.4
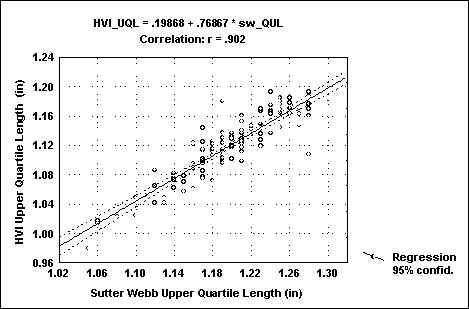
FIG .5
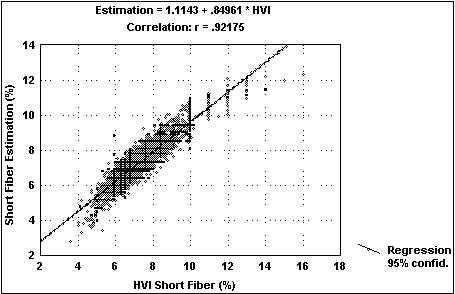
The USDA, AMS, Cotton Program has been evaluating two methods for determining short fiber content using the Zellweger Uster HVI system. The first method utilizes a short fiber index algorithm, developed by Zellweger Uster, to derive a fibrogram based short fiber index measurement (Riley, 1993). This method has been under evaluation by the Cotton Program for the past two classing seasons (Gibson, 1999). The accuracy of the measurement has improved during this time with the addition of a cotton calibration routine.
The second method being evaluated utilizes a prediction model to derive short fiber index from the HVI measurements of length and uniformity index. This model was designed to predict the short fiber measurement provided by the HVI short fiber index algorithm. Development of the predicted short fiber index measurement began in early 1998. Final revisions to the model, followed by a preliminary evaluation were carried out during the 1998 classing season. Results indicated a strong correlation (R2 = 97%) between the two HVI short fiber measurement methods. Overall reproducibility between HVIs, with a tolerance of 1.0, was 75.1% for the predicted short fiber index measurement compared to 58.7% for the HVI short fiber index algorithm.
Introduction
Short fiber content is defined as the percentage of fibers in a sample, by weight, less than one half inch in length (Bargeron, 1991). Direct short fiber content measurements can be made with methods such as the Suter-Webb Array and AFIS. Although methods such as these provide useful information, testing speed is slow and the short fiber measurement accuracy is questionable. Another option for obtaining a measurement of short fiber is through the HVI system.
All HVI length related measurements such as length and uniformity index are derived from the HVI length fibrogram. Similarly, information exists in the fibrogram to provide a measure of a cotton’s short fiber content. The short fiber measurement provided by the HVI is technically defined as a short fiber index since the HVI is capable of only an indication of the true short fiber content. Since many of the short fibers in a sample are too short to extend from the HVI’s specimen holding clamp into the optical scanning device, a direct short fiber content measurement is not possible.
HVI Short Fiber Index
The addition of the Zellweger Uster HVI Short Fiber Index measurement did not require any HVI hardware modifications. Since this measurement is derived from the same fibrogram used in the determination of length and uniformity index measurements, the only change was the addition of the short fiber algorithm to the HVI’s operating software. The first version of the HVI short fiber index measurement was evaluated in 1997. This early version did not use cotton standards as a basis for calibration. The calibration routine relied on hardware settings which were not successful in providing a common level of testing between multiple instruments (Ramey, 1998). In 1998, a short fiber cotton calibration was developed and added to the existing strength, length and uniformity index cotton calibration routine. Short fiber index values were established on an initial set of calibration cottons using an AFIS instrument.
Subsequent value establishment on replacement standards was performed by the Quality Assurance Unit on HVI’s calibrated to the initial set. Results of the 1998 evaluation showed a reduction in level differences in addition to improved reproducibility between HVI systems (Gibson, 1999). Table 1 is a summary of some of the 1998 evaluation results. Reproducibility (single test versus single test) between each classing office and Quality Assurance is given along with overall classing office averages.
Predicted Short Fiber Index
Considerable research has shown the predictability of short fiber content from HVI measurements of length and uniformity index (Zeidman, 1991; Bragg, 1994; Ramey 1998; Rowland, 1999). The concept of predicting short fiber content from the HVI measurements of length and uniformity index was investigated in 1989 (Zeidman, 1991). This work resulted in a first order prediction model known as the "Zeidman equation." More recent work has shown that an improved prediction model can be developed with the help of a second order prediction model (Rowland, 1999). The advantage of the second order model over the first is the ability to provide accurate short fiber predictions over a wider range of fiber lengths.
The Cotton Program began development of a short fiber prediction equation during the evaluations of the HVI short fiber index measurement. Several equation revisions were made as more HVI short fiber index data was collected. The data used for developing the final prediction equation came from 31,000 samples tested two times in 1998 by the Cotton Program’s Quality Assurance check lot program. These samples are representative of all the major U.S. cotton growing areas and therefore have a very wide range of fiber lengths and short fiber contents.
In addition, the data contained the necessary measurements of HVI length, uniformity index and short fiber index for development of a prediction equation. In order to give the proper weighting to the data, average short fiber indexes were calculated for every combination of length and uniformity index. A total of 269 combinations of length and uniformity index along with the averaged short fiber indexes were computed. Table 2 is a sampling of the combination data used in deriving the short fiber prediction equation. The sample count shows the data distribution for the given length grouping.
The regression analysis of the combination data set resulted in an R2 of 0.97 and produced the second order equation given below:
Z = a + bX + cY + dX2 + eY2 +fXY where
Z = Predicted Short Fiber Index
X = HVI Length
Y = Uniformity Index
a = 384.39664 b = -120.3791 c = -6.700362
d = 12.490109 e = 0.0295697 f = 1.0305676
Applying the equation back to the original data set resulted in favorable predicted short fiber reproducibility between the two tests made on each of the 31,000 samples. Reproducibility was 75.1% with a tolerance of 1.0 between the two predicted measurements. A reproducibility of 58.7% was calculated for the HVI
short fiber index on the same test data. In order to evaluate the agreement between the predicted and HVI short fiber index measurements, reproducibility was calculated within one test of the 31,000 samples. In other words, a comparison was made between the two short fiber measurement methods within the same sample fibrogram. Variability due to between test differences is therefore eliminated. The resulting reproducibility was 77.5%.
The predicted short fiber measurement provides the simplest method for obtaining HVI short fiber information. Obtaining short fiber information is simply a matter of plugging length and uniformity index measurements into the equation. Since the short fiber measurement is derived from these well established measurements, additional calibration routines and calibration standards are not required. In addition, evaluations show that the predicted measurement not only agree extremely well with the HVI short fiber measurement, but is also more repeatable.
Any new HVI measurement should provide meaningful information regarding its subsequent use (Ramey, 1997). Good progress is being made in the HVI determination of a cotton’s short fiber content. Both of the short fiber measurement methods presented in this report are showing their potential. Studies are underway in mill processing environments to assess the utility value of short fiber measurements provided by both methods. In addition, the Cotton Program plans to continue evaluating and comparing these short fiber measurement methods during the upcoming classing season.