YARN TESTING

INTRODUCTION: Yarn occupies the intermediate position in the manufacture of fabric from raw material. Yarn results are therefore essential, both for estimating the quality of rawmaterial and for controlling the quality of fabric produced. The important characteristics of yarn being tested are,

  1. yarn twist
  2. linear density
  3. yarn strength
  4. yarn elongation
  5. yarn evenness
  6. yarn hairiness etc.

SAMPLING: In order that the results obtained are reproducible and give reliable information about the material, the sampling must be true and representative of the bulk lot. The sampling procedure should be designed to take account of and to minimise the known sources of variability such as the variation between spindles, the variation along the length of the bobbin, etc. The procedure for sampling and the number of test carried out are given under each characteristic.

AMBIENT CONDITIONS FOR YARN TESTING: Some textile fibres are highly hygroscopic and their properties change notably as a function of the moisture content. Moisture content is particularly critical in the case of properties, i.e yarn tenacity, elongation, yarn evenness, imperfections, count etc. Therefore conditioning and testing must be carried out under constant standard atmospheric conditions. The standard atmosphere for textile testing involves a temperature of 20+-2 degree C, and 65+-2% Rh. In tropical regions, maintaining a temperature of 27+-2 degree C, 65+-2%RH is legitimate. Prior to testing, the samples must be conditioned under constant standard atmospheric to attain the moisture equillibrium. To achieve this it requires at least 24 hours.

TWIST: "Twist is defined asthe spiral disposition of the components of yarn, which is generally expressed as the number of turns per unit length of yarn, e.g turns per inch, turns per meter, etc.

  • Twist is essential to keep the component fibres together in a yarn.
  • The strength, dyeing, finishing properties, the feel of the finished product etc. are all dependent on the twist in the yarn.
  • With increase in twist, the yarn strength increases first , reaches a maximum and then decreases.
  • Depending on the end use, two or more single yarns are twisted together to form "plied yarns" or "folded yarns" and a number of plied yarns twisted together to form "cabled yarn".
  • Among the plied yarns, the most commonly used are the doubled yarns, wherein two single yarns of identical twist are twisted together in a direction opposite to that of the single yarns.
  • Thus for cabled and plied yarns, the direction of twist and the number of turns per unit length of the resultant yarn as well as of each component have to be determined for a detailed analysis.
  • Direction of twist is expressed as "S"-Twist or "Z"-Twist. Direction depends upon the direction of rotation of the twisting element.
  • Twist take up is defined as, "The decrease in length of yarn on twisting, expressed as a percentage of the length of yarn before twisting.

    LINEAR DENSITY OR COUNT OF YARN:

  • The fineness of the yarn is usually expressed in terms of its linear density or count.
  • There are a number of systems and units for expressing yarn fineness. But they are classified as follows

    DIRECT SYSTEM:

    1. English count(Ne)
    2. Metric count(Nm)
    3. French count(Nf)

    INDIRECT SYSTEM:

    1. Tex
    2. Denier
    1. Ne : No of 840 yards yarn weighing in One pound
    2. Nm : No of one kilometer yarn weighing in One Kilogram
    3. Nf : No of one kilometer yarn weighing in 0.5 kilogram
    4. Tex : Weight in grams of 1000 meter(1 kilometer) yarn
    5. Denier: Weight in grams of 9000 meter(9 kilometer) yarn
  • For the determination of the count of yarn, it is necessary to determine the weight of a known length of the yarn. For taking out known lengths of yarns, a wrap-reel is used. The length of yarn reeled off depends upon the count system used.
  • Another factor which determines the length of yarn taken for testing is the type of balance used. Some balances like quadrant balance, Beesley's blanace have been specially designed to indicate the yarn count directly from tests on specified short lengths of yarn and are very useful for determining the counts of yarn removed from the fabrics. The minimum accuracy of balance required is 0.001mg
  • One of the most important requirements for a spinner is to maintain the average count and count variation within control. The term count variation is generally used to express variation in the weight of a lea and this is expressed as C.V.%. This is affected by the number of samples and the length being considered for count checking. While assessing count variation, it is very important to test adequate number of leas. After reeling the appropriate length of yarn, the yarn is conditioned in the standard atmosphere for testing before it's weight is determined.
  • The minimum number of sample required per count is 20 and per machine is 2.

    YARN STRENGTH AND ELONGATION:

  • Breaking strength, elongation, elastic modulus, resistance abrasion etc are some important factors which will represent the performance of the yarn during actual use or further processing. Strength testing is broadly classified into two methods
    1. single end strength testing
    2. skein strength or Lea strength
    Tensile strength of single strands of yarn:
  • During routine testing, both the breaking load and extension of yarn at break are usually recorded for assessing the yarn quality. Most of the instruments record the load-elongation diagram also.
  • Various parameters such as initial elastic modulus, the yield point, the tenacity or elongation at any stress or strain, breaking load, breaking extension etc can be obtained from the load-extension diagram.
  • Two types of strengths can be determined for a yarn
    1. Tensile strength -load is applied gradually
    2. Ballistic strength - applying load under rapid impact conditions
  • Tensile strength tests are the most common tests and these are carried out using either a single strand or a skein containing a definite number of strands as the test specimen.
  • An important factor which affects the test results is the length of the specimen actually used for carrying out the test. The strength of a test specimen is limited by that of the weakest link in it.If the test specimen is longer, it is likely to contain more weak spots, than a shorter test specimen. Hence the test results will be different for different test lengths due to the weak spots.
  • The amount of moisture in the yarn also influences the test results. Cotton yarn when fully wet show higher strength than when dry, while opposite is the case with viscose rayon yarns. Hence, to eliminate the effect of variation due to moisture content of the yarn, all yarn strengrth tests are carried out, after conditioning in a room where the standard atmospheric condition is maintained.
  • The rate of loading as determined by the "time-to-break", which is the time interval between the commencement of the application of the load and the rupture of the yarn, is an important factor , which determines the strength value recorded by using any instrument. The same specimen will show a lower strength when the time-to-break is high, or higher when the time-to-break is low.
  • The instruments used for determining the tensile strengh are classified into three groups, based on the principle of working.
    1. CRT - Constant rate of traverse
    2. CRE - Constant rate of extension
    3. CRL - Constant rate of loading
  • In the instruments of CRE type, the application of load is made in such a way that the rate of elongation of the specimen is kep constant. In the instruments of the CRL type,the application of load is made in such a way that the rate of loading is constant througout the duration of the test. This type of instruments are usually preferred for accurate scientific work. In the CRE and CRL types of instruments, it is easy to adjust the "time-to-break" while this adjustment is not easy in the CRT types of instruments.
  • The uster Tensorapid applies the CRE principle of tensile testing. Constant Rate of Extension describes the simple fact that the moving clamp is displaced at a constant velocity. As a result, the specimen between the staionary and the moving clamp is extended by a constant distance per unit of time and the force required to do so is measured.
    Apart fron single values, this instrument also calculates mean value coefficient of variation and the 95% confidence range of maximum force, tenacity,elongation and work done
  • The total coefficient of variation describes the overall variability of a tested lot, i.e the within-sample variation plus the between-sample variation. If 20 individual single-end tensile test are performed on each of ten bobbins or packages in a sample lot, the total coefficient of variation is calculated from the pooled data of the total number of tests that were carried out.
  • In tensorapid, the breaking tenacity is calculated from the peak force which occurs anywhere between the beginning of the test and the final rupture of the specimen. The peak force or maximum force is not identical with the force measured at the very moment of rupture. The breaking elongation is calculated from the clamp displacement at the point of peak force. The elongation at peak force is no identical with the elongation at the very moment of rupture(elongation at rupture).
  • The work to break is defined as the area below the stress/strain curve drawn to the point of peak force and the corresponding elongation at peak force. The work at the point of peak force is not identical with the work at the very moment of rupture.
  • To compare tensorapid test results with other results,
    1. a measurement must be performed according the CRE princple
    2. testing speed must be exactly 5 m/min
    3. the gauge length or the length of the specimen should be 500 mm
    4. the pretension should be 0.5 cN/tex
  • There are two fundamental criteria which affect the compatibility between different measurements of tensile yarn properties.
    1. testing conditions, i.e the testing principle(CRE,CRL), testing speed, gauge length, and pre-tensioning.
    2. the second criteria,which also affects the magnitude of the differences, relates to the specific stress/strain characteristic of the yarn itself, which is determined by the fibrous materials, the blend ratio, and the yarn construction.

    Skein strength or Lea strength:

    The skein breaking strength was the most widely used measure of yarn quality in the cotton textile industry. The measurement of yarn quality by this method has certain drawbacks. Firstly, in most of the subsequent processing, such as winding, warping or weaving, yarn is used as single strand and not in the form of a skein except occasionally when sizing ,bleaching, mercerising or dyheing treatments are carrried out on hanks. Secondly, in the method used for testing skein strength, the rupture of a single strand at a weak place affects the result for the whole skein. Further, this method of test does not give an indication of the extensibility and elastic properties of a yarn, the characters which play and important role during the weaving operations. However, since a large size sample is used in a skein test as against that in a single strand test, the sampling error is less. The skein used for strength test can be used for determination of the linar density of the yarn as well.

  • In addition to the factors influencing the yarn strength, the size of the skein(lea) will affect to a large extent the strength recorded. The usual practice is to use a lea(120 yards) of yarn prepared by winding 80 turns on a wrap-reel having a perimeter of 1.5 yards(54 inches), so that during a test, there are 160 strands of 27 in.(") length. There are different systems in use. But the actual breaking strength recorded on the machine would depend on the type of skein used as both the number of strands and test length may differ. The instruments most commonly used for this test is CRT type, where the bottom hook moves at 12 inches per min.
  • After findingout skein strength, broken skeins are also weighed to determine the linear density. The most common skein used is the lea and the results of lea strength tests are expressed as C.S.P., which is the product of the linear density(count)of the yarn in the English system (Ne) and the lea breking strength expressed in lbs. In view of the fact that C.S.P. is much less dependent on yarn count than on strength, especially when count diffferences are small, C.S.P. is the mostg widely used measure of yarn qauality.
Read more...

COMBED YARN FOR KNITTING

COMBED YARN FOR KNITTING

Yarn quality requirement is changing everyday. Quality requirement is different for different end uses and it is different for different customers. It is easy to make the highest qulity yarn just for the sake of achieving the best yarn results. But it is difficult to produce a good quality yarn with a minimum deviations. Very high fluctuation in yarn quality is an EVIL for any enduse. Some times it is better to keep same level of yarn quality ( around 25% USTER STANDARDS) by strict quality control than achieving 5% USTER STANDARD but without consistency.

Consistent quality will be very much appreciated by the clients.

"I often say that when you can measure what you are speaking about and express it in numbers, you know something about it. But when you cannot measure it, when you cannot express it in numbers, your knowledge is of a meagre and unsatisfactory kind; it may be the beginning of knowledge, but you have scarcely in your thoughts advanced to the stage of science, whatever the matter may be" (attributed to Lord Kelvin, 1883).

Hence it is advisable to fix the standards for different yarn characteristics for cotton spun yarns for different end uses. The following table gives the quality requirement for KNITTING YARNS.

Table: Quality Standard for4 Ringframe Cop

Yarn Characteristicrequired value for 30S Combedother combed counts
Average count30 ( 29.6 to 30.4)nominal count plus or minus 1.3%
Count C.V%less than 1.5less than 1.5%
Twist Multiplier 3.5 to 3.6 3.5 to 3.6
TPI C.V%less than 2.5less than 2.5%
U%9.2 to 9.85 to 10 % Uster Stat . value
-50% thin place / 1000mless than 45 to 10 % Uster Stat . value
-30% thin place / 1000mless than 6505 to 10 % Uster Stat . value
+50% thick place / 1000 mless than 305 to 10 % Uster Stat . value
+200 Neps / 1000mless than 505 to 10 % Uster Stat . value
Total Imperfection / 1000 mless than 855 to 10 % Uster Stat . value
RKM ( tenacity) gms /texmore than 16.5more than 16.5
RKM C.V%less than 7.5 %5 to 10 % Uster Stat . value
Elongation %more than 5.5more than 5.5
Hairiness H4.0 to 4.5<>
Hairiness Standard Deviationless than 1.525% Uster stat value
Objectionable classimat faults(both short and long)less than 1 per 100 kmless than 1 per 100 km
Total classimat faultsless than 1505 to 10 % Uster Stat . value
H1- thin faultsless than 5 per 100 km5 to 10 % Uster Stat . value
shade variation on cones in UV lampno shade variationno shade variaition

GUIDE LINES TO ACHIEVE THE ABOVE:

RAWMATERIAL:

Raw material should be selected properly. There is a direct relationship between certain quality characteristics of the fibre and those of the yarn. 70 to 80 % of basic yarn quality is decided by cotton.

  • Short fibre content is very important for yarn quality. Uniformity Ratio should be more than 47%. Fibres of length 4 to 5 mm will be lost in porcessing (as waste and fly). Fibres upto 12 to 15mm do not contribute to strength but only to fullness of the yarn. Only the fibres above these lengths produce the other positive characteristics in the yarn.
  • 2.5% span length should be more than 28 mm. Span length affects yarn strength and yarn uniformity. End breakage rate also depends upon the fibre length. Longer the fibre, lower the end breakage rate, better the yarn quality.
  • Average Microaire should be between 3.8 to 4.3 for counts 24s to 40s (Ne). It can be between 4.1 to 4.7 for counts coarser than 24s.
  • If the micronaire is coarse, the number of fibres in the yarn cross section will be less. This always results in lower strength and lower elongation. But it is easy to process coarse micronaire fibres in blowroom and cards.
  • Nepping tendency is less for coarse micronaire fibres. On the contrary, spinnability (in both speed frame and ringframe) is not good with coarser micronaire fibres.
  • U% is affected by Micronaire. Coarser the micronaire, higher the U%. Coarser the fibre , higher the end breakage rate in spinning.
  • Uster Thin place( -30%) in the yarn vary depending upon the fibre micronaire. Lower the micronaire, lower the thin places vice versa
  • Strength of the fibre should be more than 23 grams/tex
  • Elongation of the fibre should be more than 6%.
  • No of neps per gram should be less than 250
  • should not mix two cottons with wide Reflectance value (Rd value) and yellow ness value (+b)
  • sticky cotton should not be used. If cotton is sticky, it is better to reduce the percentage of sticky cotton in the mixing. Low humidity and high temperature should be maintained in the departments
  • cottons with less contamination should be used (cottons like Andy, SJV, alto etc)

PROCESSING REQUIREMENTS:

MIXING:

  • Average Micronaire of the mixing should be same for the entire lot. The difference in average micronaire of different mixings of the same lot should not be more than 0.1
  • The micronaire C.V% of a mixing should be less than 10%
  • The micronaire Range should be same
  • Cottons with two different origins should not be mixed
  • Cottons with too wide micronaire range should not be mixed
  • Cottons with too wide reflectance value(Rd) and Yellowness value(+b) should not be mixed
  • immature fibre content should be minimum as it will affect dyeiing and will result in white-specks
  • If automatic bale openers are used, bale laydowns should be done properly, so that different micronaire bales and colors are getting mixed up homogeneously even if small quantity is being checked
  • If manual mixing is carried out, bales should be arranged and mixed properly so that different micronaire bales and colors are getting mixed up homogeneously even if small quantity is being chekced
  • for manual mixing, the tuft size should be as low as 10 grams
  • If cottons with contamination is used, the best way is to open the bales into small tufts and segregate the contaminants. There are mills who employ around 60 to 80 persons to pick up contamination from a mixing of 20tons.
  • Japanese insist on mixing atleast 36 bales for one mixing to avoid Barre problem

BLOWROOM:

  • If the micronaire is low, blowroom process parameters become very critical.
  • It is better to do a perfect preopening and reduce the beater speeds in fine opening. If required one more fine opener can be used with as low as beater speed, instead of using very high speed in only one fine opener
  • If the micronaire is lower than 3.8, it is not advisable to use machines like CVT4 or CVT3
  • Nep increase in cotton after blowroom process should be less than 80%.(i.e 180 % of rawcotton nep)
  • If the nep increase is more, then beater speeds should be reduced instead of feed roller to beater setting
  • If the trash percentage in cotton is less and the neps are more in the sliver, no of beating points can be reduced. 3 beating points should be more than enough.
  • variation in feed roller speed should be as low as possible especially in the feeding machine
  • beater types and specification should be selected properly based on the positions of the beater and the type of raw material (fibre micronaire and trash percentage)
  • the material pressure in the ducts should be as high as possible to reduce feeding variation to the cards
  • feed rollers in the chute should work continuously without more speed variation if pressure filling concept is used.(i.e. balancing of the chute should be done properly). For others, the feed roller should work at the maximum speed for a longer time.
  • material density between different chutes should be same. The difference should not be more than 7%
  • The difference in duct pressure should not be more than 40 pascals in chute feed system.
  • air loss should be avoided in the chute feed system, to reduce the fan speed and material velocity
  • blow room feeding should be set in such a way that the draft in cards is same for all the cards and the variation in feed density is as low as possible
  • fibre rupture in blowrrom should be less than 2.5%

CARDING:

  • 70% of the quality will be achieved in carding, if the wires are selected properly
  • following table can be used as a guide line for cylinder wire selection
carding productionwire heightangle of wire(degrees)points per square inch
less than 30 kgs/hr2 mm30 around 840
more than 30 kgs2mm35 to 40 900 to 1050
  • Flat tops with 400 to 500 points per square inch should be used
  • if the micronaire is lower than 3.5, the cylinder speed should be around 350rpm. If the micronaire is between 3.5 to 4.0, it can be around 450 rpm. If the micronaire is more than 4.0, it can be around 500 rpm.
  • Lower the micronaire, lower the lickerin speed. It should range from 800 to 1150 rpm depending upon the micronaire and proudction rate
  • pointed wires should be used for cyliner
  • TSG grinder should be used once in 2 months for consistent quality
  • Flat tops should be ground frequently (once in 3 months) for better yarn quality. Because, flat tops plays a major role in reducing neps and kitties in the yarn. Emery fillet rollers should be used for flat tops grinding, instead of using grinding roller grinding stone
  • Licker-in wire should be changed for every 150000 kgs produciton in carding
  • stationary flats should be changed for every 150000 kgs production in carding
  • Individual card studies upto yarn stage should be conducted regularly, and if the quality is deteriated by 25% from the average quality. card should be attended (wire mounting, grinding, full-setting etc to be done)
  • setting between cylinder and flat tops should be as close as possible, depending upon the variation between cylinder and flat tops. Care should be taken so that , wires do not touch each other.
  • Card autolevellers should be set properly. Nominal draft should be correct. Draft deviation should not be more than 5% during normal working.
  • card stoppages should be as low as possible
  • slow speed working of cards should be avoided. slivers produced during slow speed should be removed
  • 10 meters C.V% of card sliver should be less than 2.0
  • Sliver weight difference between cards should not be more than 2.5%
  • Sliver U% should be less than 3.5 and spectrogram peaks should be attended
  • cylinder loading should be nil. If cylinder is loaded, wire should be inspected. If required grinding should be done or wire should be changed
  • sliver diameter difference should be less. Calender roller pressure should be same in all the cards
  • trash in sliver should be less than 0.1%
  • uiformity ratio of sliver should be same or better than raw cotton
  • if kitties or seed coat fragments are more, higher flat speeds should be used and as much as flat waste should be removed to reduce seed coat fragments in the yarn
  • in general sliver hank varies from 0.12 to 0.14
  • individual card studies should be conducted upto yarn stage, if the quality from a particular card is bad, immediate action to be taken to rectify the problem. Lower the variation better the yarn quality.

COMBER:

  • In lap preparation, total draft, fibre parallelisation ,no of doublings, lap weight etc should be decided properly(based on trial)
  • higher the lap weight(grams /meter) lower the quality. It depends upon the the type of comber and the fibre micronaire
  • if fine micronaire is used, lap weight can be reduced to imrpove the combing efficiency
  • if coarse micronaire is used, lap weight can be increased
  • if fibre parallelisation is too much, lap sheets sticking to each other will be more( It will happen if the micronaire is very low also). If the lap sheets are sticking to each other, the total draft between carding and comber should be reduced
  • If the draft is less, fibre parallelisation will be less, hence loss of long fibres in the noil will be more
  • top comb penetration should be maximum for better yarn quality. But care should be taken so that top comb will not get damaged.
  • damaged top comb will affect the yarn quality very badly
  • setting between unicomb and top nipper should be same and it should be around 0.4mm to 0.5 mm
  • feed weight is approximately 50 to 58 grams for combers like E7/4 and is 65 to 75 grams for combers like E62 or E7/6
  • lower the feed length, better the yarn quality. Trials to be conducted with different feed lengths and it should be decided based on quality and production requirement
  • required waste should be removed with the lowest detaching distance setting
  • for cottons with micronaire upto 3.5, top comb should have 30 needles/cm and for cottons with more than 3.8 micronaire, the top comb should have 26 needles/cm
  • Trials to be conducted to standardise the waste percentage
  • piecing wave should be as low as possible. Piecing index should be decided based upon cotton length and feed length
  • spectrograms should be attended. Comber sliver uster should be less than 3.5
  • head to head waste percentage should be as low as possible
  • variation in waste percentage between combers should be as low as possible( less than 1.5%)
  • If cotton with low maturity coefficient is used, it is better to remove more noil to avoid dyeing variation problem

DRAWFRAME:

  • Drawframe with a short term Autoleveller is a must
  • no of doubling should not be less than 7 and the total draft also should be more than 7
  • U% should be around 1.5 to 1.8
  • 1 meter C.V% (from Uster Evenness Testing machine ) should be less than 0.6
  • top roller lappings should be almost nil
  • If group creeling is used, all the sliver piecings from the creel should not enter the tongue and groove roller at the same time
  • no sliver should be removed from the machine after the tongue and groove roller (which is meant for sensing the feed variation) for any reason. Because, draft correction will be done according to tongue and groove roller sensing and there is a time lag between sensing and correction.
  • top rollers should be checked by the operators atleast once in a shift
  • top rollers should be checked by the operators , whenever there is a lapping
  • top roller buffing should be done once in 20 days(maximum 30 days)
  • If the top roller eccentricity is more than 0.05 mm, it should be buffed
  • top roller eccentricity should be zero after buffing.
  • diameter variation between top rollers should be less than 0.1mm
  • sliver test should be conducted atleast once in 15 days and the A% should be less than 0.8
  • the delivery speed should be around 400 to 500 meters per minute depending upon the make of the machine
  • whenever there is a top roller lapping, min 10meters of sliver should be removed from the can
  • creel breaks should be as low as possible and it need to be piececd properly. Trials should be taken to see the yarn made out of piecing. Piecings should not be too thick and high twisted

SPEED FRAME:

  • Total draft should be around 10 for 4 over 4 drafting system
  • better to use floating condenser in the front zone to reduce hairiness and the diameter of the roving
  • cots buffing should be done once in two months. top roller runout to be checked and it should be nil. There should not be any compromise on top roller quality. Top roller cost for speed frame is negligible if it is compared with ringframe
  • If possible it should be treated with surface treatment like treatment with LIQIMIX or treated with acid to reduce top clearer waste which is caused by top roller surface
  • Twist Multplier should be high enough to reduce stretch in Ringframe. Higher the T.M lower the classimat "H1" faults
  • If single speed for flyer is used, it is advisable to run less than 1000 rpm
  • When the speed frame bobbin is full, flyer speed should be less than 1000 rpm. Otherwise surface cuts will increase and thin places also will increase
  • False twisters should be changed once in two years. Variation in false twister will result in high count C.V%
  • Roving tension should be as low as possible and as uniform as possible. Higher the roving tension, higher the count C.V% and higher the thin places
  • Density of all roving bobbins should be same. Higher the variation, higher the count C.V%
  • Break draft should be around 1.18 to 1.24 depending upon the type of drafting system and total draft
  • Roving hank should be decided in such a way that the ring frame draft is around 20 to 34 for different counts.
  • no sliver piecing or roving piecing from speedframe should be worked in Ringframe. All sliver piecing and roving piecing will result in thin and thick yarn. Some times it may be cut by the clearer, but all yarn faults created by piecings are not cut by the clearers.

RINGFRAME:

  • Front zone setting should be as close as possible
  • breakdraft of 1.14 and back zone setting of 60 mm is recommended
  • 65 degree shore hardness for front top roller
  • buffing should be carried out once in 45 days
  • if the top roller diameter is less by 1.5 mm from the standard diamter, top roller should be changed
  • the gap between front top roller and apron nip should be as low as possible(around 0.5 to 1 mm). If it is more imperfections will be high
  • bottom and top aprons should be changed atleast once in 1.5 years
  • It is better to use lighter travellers instead of using heavier travellers.
    Enough trials should be taken , because traveller size depends upon, speed, micronaire, humidity condition, count, ringdiameter etc
  • It is advisable to use Eliptical travellers for hosiery counts
  • ring travellers should be changed before 1.5% of travellers burn out
  • whenever there is a multiple break, ring travellers should be changed
  • At any point of time, fluff accumulation on travellers should be less. Ring traveller setting should be close enough to remove the waste accumulation but at the same time it should not disturb the travller running
  • hariness varition between spindles should not be high. To achieve this, traveller should be changed in time, bad workings (multiple breaks) should be avoided, rings like TITAN rings (from Breaker) should be used, damaged rings should be removed
  • Ring frame breaks should be as low as possible ( less than 10 breaks per 1000 spindle hours)
  • Start up breaks after doffing should be less than 3 %.
  • Overhead cleaners is a must for processing combed cotton
  • Exhaust trenches should be between machines and for every 200 spindles there should be a trench
  • ring centering should be perfect. Abc rings and lappet hook centering should also be done perfectly
  • If ring diameter is more than 40 mm, ring centering plays a major role. If ring centering is not done properly, hairiness variation within the chase will be very high
  • good quality spindle tapes should be used and changed for every 24 months. Spindle speed variaiton will affect yarn strength, tpi and hairiness

WINDING:

  • Winding speed should be around 1250 meters/ min
  • machines with tension management is preferred
  • Clearers settings should be as close as possible. Loephe Yarn master setting is given below

N -4.0 (nep) : DS-2.0 (short) : LS-1.6 (short) : DL-1.18 (long) : LL-40 : (long) -DS-14%(thin) : -DL-40(thin)

Since loephe has a facility of class clearing. "C"s to be added in such a way that the following faults which are displayed in Loephe class clearing should be cleared.

A4,A3,B4,B3, B2(50%),C1,C2,C3,C4,D1,D2,D3,D4,E,F,G,H1(50%),H2,I1,I2

  • Count channel setting should be less than 7%
  • setting for cluster faults should be set such that, if a yarn produced without bottom apron, or damaged rubber cots is fed, it should be cut by the clearer
  • long thick faults in the cone yarn should be zero
  • long thin faults should be zero
  • If the waxing attachment is below the clearers, the clearers should be cleaned once in a day
  • splice strength should be more than 75% of yarn strength
  • splice apperance should be good and all the splicers should be checked atleast once in a week
  • good qulity wax should be used
  • wax pick up should be around 0.1%
  • uniform application of wax to ensure uniform coefficient of friction (0.125 to 0.15)
  • uniform moisture in the cones is important, because coefficient of friction varies as a function of moisture
  • all wax rollers should rotate properly
  • repeaters should be as low as possible, because this will affect the package quality
  • It is advisable to produce cones with 1.8 to 2.4 kgs
  • yarn tension in winding should not be very high
  • imperfection increase between ringframe and winding should not be more than 30% for cotton combed yarns

GENERAL:

  • finished garments rejection should be less than 1%
  • yarn faults contribute to 25% of the rejections. Major yarn faults are

contamination

thick and thinks

Unevenness

periodicity

Stiff yarn - Higher TPI ( holes)

higher friction

high hairiness variation

mixed properties of yarn - "Barre"

Neps

white specs(immature fibres)

Kitties ( vegetable matters, dust content)

Lower elongation and elasticity

  • It is better to use cottons with less contaminations like Andy, SJV, Alto, etc
  • contaminations of length more than 20 mm should be nil in the yarn
  • as per japanese standard, the no of contamination per Kg of fabric should be less than 5
  • If cotton has contamination, it is compulsary to use manual picking on preopener lattice, cotamination detectors at blowroom, visual clearer(siro) at winding.
  • It is advisable to go to the supplier(cotton ginner) for quality - a concept of Japanese
  • 10 meter C.V% of yarn should be controlled and it should be as low as possible. This affects the fabric appearance
Read more...

YARN EVENNESS

Non-uniformity in variety of properties exists in yarns. There can be variation twist.,bulk, strength, elongation , fineness etc.
Yarn evenness deals with the variation in yarn fineness. Thisis the   property, commonly measured as the variation in mass per unit length along the yarn, is a basic  and important one, since it can influence so samy other properties of the yarn and offabric made  from it. Such variations are inevitable, because they arise from the fundamental nature of textile fibres and from their resulting arrangement.

The spinner tries to produce a yarn with the highest possible degree of homogeneity. In this connection, the evenness of the yarn mass is of the greatest importance. In order to produce an absolutely  regular yarn, all fibre characteristics would have to be uniformly distributed over the whole thread. However, that is ruled out by the inhomogeneity of the fibre material and by the mechanical constraints.
Accordingly, there are limits to the achievable yarn eveness.

IMPORTANCE OF YARNEVENNESS:

Irregularity can adversely affect many of the properties of textile materials. The most obvious consequence of yarn evenness is the variation of strength along the yarn. If the average mass per unitlength of two yarns is equal, but one yarn is less regular than the other, it is clear that the more even yarn will be the stronger of the two.The uneven one should have more thin regions than the even one as a result of irregularity, since the average linear density is the same. Thus, an irregular yarn will tend to break more easily during spinning, winding, weaving, knitting, or any other process where stress
is applied.

A second qality-related effect of uneven yarn is the presence of visible faults on the surface of fabrics. If a large amount of irregularity is present in the yarn, the variation in fineness can easily be detected in the finished cloth. The problem is particularly serious when a fault(i.e a thick or   thin place) appears at precisely regular intervals along the length of the yarn. In such cases, fabric construction geometry ensures that the faults will be located in a pattern that is very clearly
apparent to the eye, and defects such as streaks, stripes, barre, or other visual groupings develop in the cloth. Such defects are usually compounded when the fabric is dyed or finished, as a result of  the twist variation accompanying them.

Twist tends to be higher at thin places in a yarn. Thus , at such locations, the penetration of a dye or  finish is likely to be lowe than at the thick regions of lower twist. In consequence, the thicker yarn region will tend to be deeper in shade than the thinner ones and, if a visual fault appears in a pattern on the fabric, the pattern will tend to be emphasized by the presence of colour or by some variation in  a visible property, such as crease-resistance controlled by a finish.
Other fabric properties, such as abrasion or pill-resistance, soil retention, drape, absorbency,  reflectance, or lustre, may also be directly influenced by yarn evenness. Thus, the effects of   irregularity are widespread throughout all areas of the production and use of textiles, and the topic is an important one in any areas of the industry.

"UNEVENNESS" OR "IRREGULARITY":

The mass per unit length variation due to variation in fibre assembly is generally known as "IRREGULARITY" or "UNEVENNESS". It is true that the diagram can represent a true relfection of the mass or weight per unit length  variation in a fibre assembly. For a complete analysis of the quality, however, the diagram alone is not enough. It is also necessary to have a numerical value which represents the mass variation.  The mathematical statistics offer 2 methods

the irregularity U% : It is the percentage mass deviation of unit length of material and is caused by
uneven fibre distribution along the length of the strand.
the coefficient of variation C.V.%
In handling large quantities of data statistically, the coefficient of variation (C.V.%) is commonly used to define variability and is thus well-suited to the problem of expressing yarn evenness. It is currently probably the most widely accepted way of quantifying irregulariy. It is given by

coefficient variation (C.V.%) = (standard deviation/average) x 100

The irregularity U% is proportional to the intensity of the mass variations around the mean value. the U% is independent of the evaluating time or tested material length with homogeneously   distributed mass variation. the larger deviations from the mean value are much more intensively taken into consideration in the calculation of the coefficient of variation CV(squaring of the term) C.V.% has received more recognition in the modern statistics than the irregularity value U. The coefficient of variation CV can be determined extremely accurately by electronic means, whereas the calculation of the irregularity U is based on an approximation method. It can be considered that if the fibre assembly required to be tested is normally distributed with respect to its mass variation, a conversion possibility is available between the two types of calculation.

C.V.% = 1.25 * U%

INDEX OF IRREGULARITY":

Index of irregularity expresses the ratio between the measured irregularity and the so-called limiting irregularity of an ideal yarn. The manner in which irregularity is assessed can lead to different ways of expressing the index.

In calculating the limit irregularity, the assumption is made that, in the ideal case, fibre distribution in a yarn is completely random and a practical yarn can never improve upon this situation.Thus, the   measured irregularity will be an indication of the extent to which fibre distribution falls short of  complete randomness. If all fibres are uniform in cross-sectional size, it can be shown that the  limiting irregularity expressed in terms of C.V is given by

C.V.(limit) = 100 / sqrt(N)

This expression also assumes a POISSON distribution in the values around "N"(the mean number of fibres  in the cross section)

Let
C.V.lim = the calculated limit irregularity
C.V. = the actual irreglarity
Then,
Index of Irregularity (I) = C.V / C.V.lim

By calculating the limit irregularity and then measuring the actual irregularity, we can judge the spinning performance.

DEVIATION RATE:

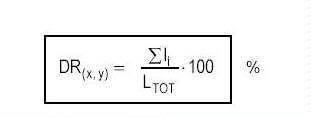
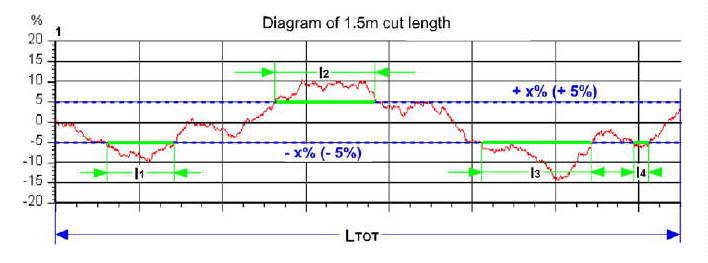
Deviation rate describes by what percentage a mass deviation exceeds or falls below a certain limit. The cut length factor in m averages out the shorter, higher deviations

DR (xy) =  (L1+l2..+Ln) x 100 / L tot

DR = Total relative length in (%) of all deviations of the mass signal which surpass the limit  +/- x% over a total test length of L meters, with the cut length of curve being y meters.


DR.jpg (29893 bytes)

FORMULA FOR DR PERCENTAGE:

DR1.jpg (4016 bytes)

The standard DR used for yarn is 1.5 m cutlength at a +/- 5% limit. The application of DR is similar to that of the CVm values. One has to take in to consideration that  the DR is based on threshhold values and changes more significantly than CV values when higher mass deviations over long stretches of test material arise.

THe deviation rate is calculated by comparing all the deviations of the positive range with the whole test length Ltot.  The same is valid for all deviations  in the negative range. As the zero line corresponds to the median , the Deviation Rate (DR) can reach the maximum of 5 0%.

DETERIORATION IN EVENNESS DURING PROCESSING:

In processing in the spinning mill, the unevenness of the product increases from stage to stage after drawframe. There are two reasons for this

The number of fibres in the cross section steadily decreases. Uniform arrangement of the fibres becomes more difficult, the smaller their number.
Each drafting operation increases the unevenness
Each machine in the spinning process adds a certain amount to the irregularity of finished yarn. The resultant irregularity at the output of any spinning process stage is equal to the square root of the sum of the squares of the irregularities of the material and the irregularity introduced in the process.

Let us assume that,
CVo - CV of output material
CV1 - CV of input material
CV - irregularity introduced by machine

then,

CVo = sqart(CV1 + CV)

UNEVENNESS OVER DIFFERENT CUT LENGTHS:

A length of yarn, for example of 10mm, contains only few fibres. Every irregular arrangement of only some of these fibres has a strong influence on the unevenness. In a length of yarn of 10m, incorrect arrangement of the same fibres would hardly be noticed against the background of the large number  of such fibres. Accordingly, the CV value of the same yarn can be, for example, 14% based on, 8mm, and only 2% based on 100 m. The degree of irregularity is dependent upon the regerence length.
Unevenness is therefore discussed in terms of short lengths(uster tester):medium lengths(seldom  used):long lengths(count variation).

Fabric stripiness and barre have been problematic fabric defects in the textile industry for many years. Though direct quantification has not been possible, the causes for such fabric defects have been studied. It has been shown that raw material quality and yarn mass variations (particularly medium and long term variations) contribute significantly to the guidance of such faults. Of these causes, there has been a general neglect of the control of medium term variations (variations over 1m, 3m,10m, etc). A mill needs to control the cut length variations of the yarn produced in order to ensure a fault free fabric.

If the variation of cut length C.V.% of 1 meter, 3 meters, 10 meters is high , when different cops are tested , the fabric appearance will be very badly affected. It will result in fabric defects such as stripiness.

IMPERFECTIONS:

Yarns spun from staple fibres contain "IMPERFECTIONS" . They are also referred to as frequently occurring yarn faults. They can be subdivided into three groups

Think places
Thick places
Neps
The reasons for these different types of faults are due to rawmaterial or improper preparation process. A reliable analysis of these imperfections will provide some reference to the quality of the raw material used.

Thick places and thin places, lie in the range of +-100% with respect to the mean value of yarn cross-sectional size.The Neps will overstep +100% limit.

Thick places over +100% are analysed by the CLASSIMAT system, are cut by the clearers in winding depending upon the end use of the yarn.

Imperfection indicator record imperfections at different sensitive levels.

Thin place
-30% : yarn cross section is only 70% of yarn mean value
-40% : yarn cross section is only 60% of yarn mean value
-50% : yarn cross section is only 50% of yarn mean value
-60% : yarn cross section is only 40% of yarn mean value
Thick place
+35% : the cross section at thick place is 135% of yarn mean value
+50% : the cross section at thick place is 150% of yarn mean value
+70% : the cross section at thick place is 170% of yarn mean value
+100%: the cross section at thick place is 200% of yarn mean value
Neps
400%: the cross section at the nep is 500% of the yarn mean value
280%: the cross section at the nep is 380% of the yarn mean value
200%: the cross section at the nep is 200% of the yarn mean value
140%: the cross section at the nep is 140% of the yarn mean value
Thick places and thin places which overstep teh minimum actuating sensitivity of +35% and -30% ,  respectively, correspond to their length to approximately the mean fibre length. Medium length or long thick and thin places are to be considred as mean value variations and are not counted by the instrument.

The standard sensitive levels are as follows

Thin place : -50%
Thick place : +50%
Neps : 200% ( 280% for open-end yarns)

The reason for reducing the sensitivity of nep counting in rotor spun yarns is due to the fact that with these yarns, the neps tend to be spun into the core of the yarn and therefore are less visible to the human eye in the finished product. With ring spun yarns, on the other hand, the neps, in general  tend to remain on the surface of the yarn. Due to the above reasons, while a nep is considered serious
for a ring spun yarn even if its size exceeds +200%, it becomes serious only after its size  exceeds +280% for open end yarns.

It is however worth mentioning here that, though the imperfection values at standard sensitiviy levels i.e. +50% for thick places and -50% for thin places indicate the acceptable quality levels in terms  of fabric appearance, the quality of processing in terms of optimization of process parameters will  be better indicated by imperfections at higher sensitivity levels. It is commonly observed that while the thin places may be '0' for any two mills at the standard sensitivity level of -50%, the  thin places at -40% sensitivity may show a big difference.

Thin places and thick places in a yarn can, on the one hand, quite consdierably affect the appearance  of a woven or knitted fabric. Furthermore, an increase in the number of thin places and thick places   refer to a particularly valuable indication that the raw material or the method of processing has become worse. On the other hand, it cannot be concluded from the increased number of thin place faults that this yarn, the downtime of weaving or knitting machines will be increased to a similar degree.  Thin places usually exhibit a higher yarn twist, because of fewer fibres in the cross-section resulting in less resistance to torsion. The yarn tension does not become smaller proportionally with a reduced number
of fibres. With thick plalce faults the contrary is the case. More fibres in the cross-section result  in a higher resistance to torsion. Thic places have therefore, in many cases, a yarn twist which is lower than the average. The yarn tension in the yarn at the position of the thick place is only in very few  cases proportional to the number of fibres. These considerations are valid primarily for ring-spun yarns.

Neps can influence the appearance of woven or knitted fabrics quite considerably. Furthermore neps of a certain size can lead to processing difficulties, particularly in the knitting machines. Therefore the avoidance  of neps in the production of spun yarns is a fundamental textile technological problem.

Neps can be divided, fundamentally , into two catergories:
-raw material neps
-processing neps

The rawmaterial neps in cotton yarn are primarily the result of vegetable matter and immature fibres in the raw material. The influence of the rawmaterial with wool and synthetic fibres in terms of nep production is negligible. Processing neps are produced at ginning and also in cotton , woollen and worsted carding. Their fabrication is influenced by the type of card clothing, the setting of the card flats, workers and strippers, and by the production speeds used.

SPECTROGRAM:

"DIAGRAM" is a representation of the mass variations in the time domain. Whereas SPECTROGRAM is a representation of the mass variation in the frequency domain. Spectrogram helps to recognize and analyse the periodic fault in the sliver, roving and yarn.

For textile application, the frequency spectrum is not practical. A representaion which makes reference to the wavelength is preferred. Wavelength indicatres directly at which distance the periodic faults repeat. The more correct indication of the curve produced by the spectrograph is the wave-length spectrum.
Frequency and wavelength are related as follows

frequency = (wavelength)/(material speed)

In the SPECTROGRAM, the X-axis represents the wavelength. Inorder to cover a maximum range of wavelengths, a logrithmic scale is used for the wavelength representation. The y-axis is without scale but represents the amplitude of the faults in yarn.

The spectrogram consists of shaded and non-shaded areas. If a periodic fault passes through the measuring head for a minimum of 25 times, then it is considered as significant and it is shown in the shaded area. Wavelength ranges which are not statistically significant are not shaded. In this range the faults
are displayed but not hatched. This happens when a fault repeats for about 6 to 25 times within the  tests length of the material.

As far as those faults in the unshaded area is concerned, it is recommended to first confirm the seriousness of the fault before proceeding with the corrective action. This can be done by testing a longer length of yarn. Faults which occur less than 6 times will not appear in the spectrogram.

A spectrogram starts at 1.1 cm if the testing speed is 25 to 200 m.min. It starts at 2.0cm if the  testing speed is 400 m/min and it starts at 4 cm if the speed is 800 m.min. For spun material the maximum wavelength range is 1.28 km. Maximum number of channels is 80

Depending upon the wavelength of the periodic fault, the mass variations are classified as

short-term variation( wavelength ranges from 1 cm to 50cm)
medium-term variation( wavlength ranges from 50cm to 5 m)
long-term variation(wavelength longer than 5 m)


periodic variations in the range of 1 cm to 50 cm are normally repeated a number of times within the  woven or knitted fabric width, which results in the fact periodic thick places or thin places will lie near to each other. This produces, in most cases, a "MOIRE EFFECT". This effect is particularly  intensive for the naked eyes if the finished product is observed at a distance of approx. 50 cm to 1m.


Periodic mass variations in the range of 50cm to 5m are not recognizable in every case. Faults in this range are particularly effective if the single or double weave width, or the length of the stretched out yarn one circumference of the knitted fabric, is an integral number of wave-lengths of the periodic fault, or is near to an integral number of wave-lengths. In such cases, it is to be expected that weft stripes will appear in the woven fabric or rings in the knitted fabric.


Periodic mass variations with wave-lengths longer than 5m can result in quite distinct cross-stripes in woven and knitted fabrics, because the wave-length of the periodic fault will be longer than the width of the woven fabric or the circumference of the knitted fabric. The longer the wavelength, the wider will be the width of the cross-stripes.Such faults are quite easily recognizable in the finished product, particularly when this is observed from distances further away than 1 m.


A periodic mass variation in a fibre assembly does not always result in a statistically significant  difference in the U/V value. Nevertheless, such a fault will result in a woven or knitted fabric and   deteriorate the quality of the fabric. Such patterning in the finished product can become intensified after dyeing. This is particularly the case with uni-coloured products and products consisting of synthetic fibre filament yarns.

The degree to which a periodic fault can affect the finished product is not only dependent on its intensity but also on the width and type of the woven or knitted fabric, on the fibre material, on the yarn count, on the dye up-take of the fibre, etc. A considerable number of trials have shown that the height of the peak above the basic spectrum should not overstep 50% of the basic spectrum height at the wavelength position where the peak is available.

CHIMNEY TYPE FAULTS:

The eccentricity roller results in a sinusoidal mass variation whereby the periodicity corresponds to full circumference of the roller. With one complete revolution of an OVAL roller, a sinusoidal mass variation also results, but 2 periodic faults are available. Chimney type of faults are mainly due to  -mechanical faults -eccentric rollers, gears etc -improper meshing of gears -missing gear teeth -missing teeth in the timing belts -damaged bearings etc

HILL TYPE FAULTS:

These faults are due to drafting waves caused by -improper draft zone settings -improper top roller pressure -too many short fibres in the material, etc  Numerous measurements of staple-fibre materials have shown that there are rules for the correlation between the appearance of drafting waves in the spectrogram and the mean staple length. It is given below


-yarn : 2.75 x fibre length
-roving : 3.5 x fibre length
-combed sliver : 4.0 x fibre length
-drawframe sliver : 4.0 x fibre length


A periodic fault which occurs at some stage or another in the spinning process is lengthened by subsequent drafting.If the front roller of the second drawframe is eccentric, then by knowing the  various drafts in the further processes, the position of the peak in the spectrogram of the yarn measurement can be calculated.

The wavelength of a defective part is calculated by multiplying the circumference of the part and  the draft upto that part.

The wavelength of a defective part can be calculated if the rotational speed of the defective part and the production speed are known.

Doubling is no suitable means of eliminating periodic faults. Elimination is only possible in exceptional  cases. In most cases, doubling can, under the best conditions, only reduce the periodic faults.

The influence of periodic mass variation is proportional to the draft.

Due to the quadratic addition of the partial irregularities, the overall irregularity of staple-fibre yarns increases due to the periodic faults only to an unimportant amount.

Read more...

Testing of fibers (textile) HIGH VOLUME INSTRUMENT SYSTEM

HIGH VOLUME INSTRUMENT SYSTEM

The testing of fibres was always of importance to the spinner. It has been known for a long time that the fibre characteristics have a decisive impact on the running behaviour of the production machines, as well as on the yarn quality and manufacturing costs. In spite of the fact that fibre characteristics are very important for yarn yarn proudction, the sample size for testing fibre characteristics is not big enough. This is due to the following

  • The labour and time involvement for the testing of a representativesample was too expensive. The results were often available much too late to take corective action.
  • The results often depended on the operator and / or the instrument, and could therefore not be considered objective
  • one failed in trying to rationally administer the flood of the rawmaterial data, to evaluate such data and to introduce the necessary corrective measures.

Only recently technical achievements have made possible the development of automatic computer-controlled testing equipment. With their use, it is possible to quickly determine the more important fibre characteristics.

Recent developments in HVI technology are the result of requests made by textile manufacturers for additional and more precise fibre property information. Worldwide competitive pressure on product price and product quality dictates close control of all resources used in the manufacturing process.

Following are the advantages of HVI testing

  • the results are practically independent of the operator
  • the results are based on large volume samples, and are therefore more significant
  • the respective fibre data are immediately available
  • the data are clearly arranged in summerised reports
  • they make possible the best utilisation of rawmaterial data
  • problems as a result of fibre material can be predicted, and corrective measures instituted before such problems can occur

Cotton classification does not only mean how fine or clean, or how long a fibre is, but rather whether it meets the requirements of the finished product. To be more precise, the fibre characteristics must be classified according to a certain sequence of importance with respect to the end product and the spinning process.

The ability to obtain complete information with single operator HVI systems further underscores the economic and useful nature of HVI testing.

Two instrument companies located in the US manufacture these HVI systems. Both the systems include instruments to measure micronaire, length, length uniformity, strength, colour, trash, maturity, sugar content etc.

LENGTH:

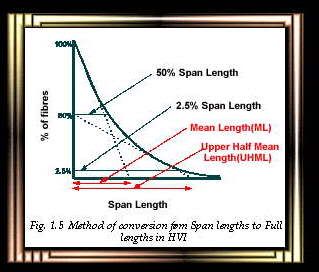
The length measure by HVI systems used by the USDA is called upper-half-mean length. This is the average or mean length of the longest one-half of the fibres in the sample. The spinlab system uses the fibrosampler device to load the fibres on needles, the motion control system uses the Specimen Loader to capture the fibres in a pinch clamp. However the preparation of the length specimen for both systems includes combin to straighten and parallel the fibres, and brushing to remove fibre crimp. The length measurement is then made by the instrument scanning along the length of the specimen to determine the length data.

The insturments are calibrated to to read in staple length. Length measurements obtained from the instrument are considerably more repeatable than the staple length determination by the classer. In one experiment the instrument repeated the same staple length determination 44% of the time while the classer repeated this determination only 29% of the time. Similarly, the instrument repeated to 1/32" on 76% of the samples, while the classer agreed on 71% of the samples to within 1/31".

The precision of the HVI length measurement has been improved over the last few years. If we take the same bale of cotton used in the earlier example and repeatedly measure length with an HVI system, over two-thirds of measurements will be in a range of only about 1/32 nd of an inch: 95% of the individual readings will be within 1/32nd of an inch of the bale average. In the 77000 bales tested, the length readings were repeated within 0.02" on 71% of the bales between laboratories.

LENGTH UNIFORMITY:

The HVI system gives an indication of the fibre length distribution in the bale by use of a length uniformity index. This uniformity index is obtained by dividing the mean fibre length by the upper-half-mean length and expressing the ratio as a percent. A reading of 80% is considered average length uniformity. Higher numbers mean better length uniformity and lower numbers poorer length uniformity.

A cotton with a length uniformity index of 83 and above is considered to have good length uniformity, a length uniformity index below 78 is considered to show poor length uniformity.

Repeated measurements on a single bale of cotton show the length uniformity index measurement to have relatively low precision. About two-thirds of the measurements will occur within one unit of length uniformity; thus a bale with an average length uniformity index of 80 would have 68% of the readings occuring between 79 and 81, and 95% of hte readings occuring between 78 and 82. This does not seem too bad until one considers that most US upland cottons will have a length uniformity reading between 75 and 85.

Most organizations operate their HVI systems to use an average of 2 or 4 readings per bale for the length uniformity index. Using that number tests per bale, the USDA test of 77000 bales showed that laboratoriesat different locations agreed 68% of the time to within one length uniformity index unit.

In some cases low length uniformity has correlated with high short fibre content. However, in general the correlations between length uniformity index and short fibre content have not been very good. One important reason why the length uniformity index is a not a very good indicator of the short fibre content has to do with the fact that the HVI systems do not measure the length of any fibres shorter than about 4mm.

Another reason for the poor correlations between length uniformity index and short fibre content is that the short fibre content is related to staple length while the length uniformity index is fairly independent of staple length. As an example, the shorter staple cottons tend to contain higher amounts of short fibre than the longer staple cottons. Howeer, many short staple cottons have length uniformity index readings above 80.

MICRONAIRE:

The micronaire reading given by the HVI systems is the same as has been used in the commercial marketing of cotton for almost 25 years. The repeatability of the data and the operator ease of performing the test have been improved slightly in the HVI micronaire measurement over the original instruments by elimination of the requirement of exactly weighing the test specimen. The micronaire instruments available today use microcomputers to adjust the reading for a range of test specimen sizes.

The micronaire reading is considered both precise and reperable. For example, if we have a bale of cotton that has an average micronaire of 4.2 and repeatedly test samples from that bale, over two-thirds of thet micronaire readings will be between 4.1 and 4.3 and 95 %of the readings between and 4.0 and 4.4. Thus, with only one or two tests per bale we can get a very precise measure of the average micronaire of the bale.

This reading is also very repeatable from laboratory to laboratory. In USDA approx 77000 bales were tested per day in each laboratory, micronaire measurements made in different laboratories agreed with each other within 0.1 micronaire units on 77% of the bales.

The reading is influenced by both fibre maturity and fibre fineness. For a given growing area, the cotton variety generally sets the fibre fineness, and the environmental factors control or influence the fibre maturity. Thus , within a growing area the micronaire value is usually highly related to the maturity value. However, on an international scale, it cannot be known from the micronaire readings alone if cottons with different micronaire are of different fineness or if they have different maturity levels.

STRENGTH:

The strength measurement made by the HVI systems is unlike the traditional laboratory measurements of Pressley and Stelometer in several important ways. First of all the test specimens are prepared in a very different manner. In the laboratory method the fibres are selected, combed and carefully prepared to align them in the jaw clamps. Each and every fibre spans the entire distance across the jaw surfaces and the space between the jaws.

In the HVI instruments the fibres are ramdomly selected and automatically prepared for testing. They are combed to remove loose fibres and to straighten the clamped fibres, also brushed to remove crimp before testing. The mechanization of the specimen preparation techniques has resulted in a "tapered" specimen where fibre ends are found in the jaw clamp surfaces as well as in the space between the jaws.

A second important difference between traditional laboratory strength measurements and HVI strength measurements is that in the laboratory measurements the mass of the broken fibres is determined by weighing the test specimen. In the HVI systems the mass is determined by the less direct methods of light absorption and resistance to air flow. The HVI strength mass measurement is further complicated by having to measure the mass at the exact point of breaks on the tapered specimen.

A third significant difference between laboratory and HVI strength measurements is the rate or speed at which the fibres are broken. The HVI systems break the fibres about 10 times faster than the laboratory methods.

Generally HVI grams per tex readings are 1 to 2 units (3 to 5%) hihger in numerical value. In some individual cases that seem to be related to variety, the differences can be as much as 6 to 8% higher. This has not caused a great deal of problems in the US, perhaps because a precedent was set many years ago when we began adjusting our Stelometer strength values about 27% to put them on Presseley level.

Relative to the other HVI measurements, the strength measurement is less precise. Going back to our single bale of cotton and doing repeated measurements on the bale we shall find that 68% of the readings will be within 1 g/tex of the bale average. So if the bale has an average strength of 25 g.tex, 68% of the individual readings will be betweeen 24 and 26 g/tex, and 95% between 23 and 27 g/tex.

Because of this range in the readings within a single bale, almost all HVI users make either 2 or 4 tests per bale and average the readings. When the average readings are repeated within a laboratory, the averages are repeated to within one strength unit about 80% of the time. However, when comparisons are made between laboratories the agreement on individual bales to within plus or minus 1 g/tex decreases to 55%.

This decrease in strength agreement between laboratories is probably related to the difficulty of holding a constant relative humidity in the test labs. Test data indicate that 1% shift in relative humidity will shift the strength level about 1% . For example, if the relative humidity in the laboratory changes 3% ( from 63 to 66%), the strength would change about 1 g/tex ( from 24 to 25 g/tex)

COLOUR:

The measurement of cotton colour predates the measurement of micronaire, but because colour has always been an important component of classer's grade it has not received attention as an independent fibre property. However the measurement of colour was incorporated into the very early HVI systems as one of the primary fibre properties.

Determination of cotton colour requires the measurement of two properties, the grayness and yellowness of the fibres. The grayness is a measure of the amount of light reflected from the mass of the fibre. We call this the reflectance or Rd value. The yellowness is measured on what we call Hunter's +b scale after the man who developed it. The other scales that describe colour space (blue, red, green) are not measured becasue they are considered relatively constant for cotton.

Returning once again to the measurements on our single bale, we see that repeated measurements of colour are in good agreement. For grayness or reflectance readings, 68% of the readings will be within 0.5 Rd units of the bale average, and 95% within one Rd unit for the average.

As for yellowness, over two-thirds of these readings will be within on-fourth of one +b unit of the average, and 95% within one-half of one +b unit. The grayness (Rd) and yellowness (+b) measurements are related to grade through a colour chart which was developed by a USDA researcher. The USDA test of 77000 bales showed the colour readings to be the most repeateable of all data between laboratories; 87% of the bales repeated within one grayness(Rd) unit, and 85% repeated within one-half of one yellowness(+b) unit.

TRASH CONTENT:

The HVI systems measure trash or non-lint content by use of video camera to determine the amount of surface area of the sample that is covered with dark spots. As the camera scans the surface of the sample, the video output drops when a dark spot (presumed to be trash) is encountered. The video signal is processed by a microcomputer to determine the number of dark spots encountered (COUNT) and the per cent of the surface area covered by the dark spots (AREA). The area and count data are used in an equation to predict the amount of visible non-lint content as measured on the Shirley Analyser. The HVI trash data output is a two-digit number which gives the predicted non-lint content for that bale. For example, a trash reading of 28 would mean that the predicted Shirley Analyser visible non-lint content of that bale would be 2.8%.

While the video trash instruments have been around for several years, But the data suggest that the prediction of non-lint content is accurate to about 0.75% non lint, and that the measurements are repeatable 95% of the time to within 1% non-lint content.

SHORT FIBER CONTENT:

The measure of short-fiber content (SFC) in Motion Control's HVI systems is based on the fiber length distribution throughout the test specimen.

It is not the staple length that is so important but the short fiber content which is important. It is better to prefer a lower commercial staple, but with a much lower short-fibre content.

The following data were taken on yarns produced under identical conditions and whose cotton fibers were identical in all properties except for short-fiber content. The effects on ends down and several aspects of yarn quality are shown below.

LOT -A, (8.6% SFC) LOT-B (11.6% SFC)
Ends down / 1000 hrs 7.9 12.8
Skein strength (lb) 108.1 97.4
Single end strength g/tex 15 14.5
apperance index 106 89
Evenness (CV%) 16 17.3
Thin places 15 36
Thick places 229 364
Minor Defects 312 389

These results show that an increase of short-fiber content in cotton is detrimental to process efficiency and product quality.

HVI systems measure length parameters of cotton samples by the fibrogram technique. The following assumptions describe the fibrogram sampling process:

  • The fibrogram sample is taken from some population of fibres
  • The probability of sampling a particular fiber is proportional to its length
  • A sampled fiber will be held at a random point along its length
  • A sampled fiber will project two ends away from the holding point, such that all of the ends will be parallel and aligned at the holding point.
  • All fibers have the same uniform density

The High Volume Instruments also provide empirical equations of short fibre content based on the results of cotton produced in the United States in a particular year.

Short Fibre Index = 122.56 - (12.87 x UHM) - (1.22 x UI)

where UHM - Upper Half Mean Length (inches) UI - Uniformity Index

Short Fibre Index = 90.34 - (37.47 x SL2) - (0.90 x UR)

Where SL2 - 2.5% Span length (inches) UR - Uniformity Ratio

In typical fibrogram curve, the horizontal axis represents the lengths of the ends of sampled fibers. The vertical axis represents the percent of fiber ends in the fibrogram having that length or greater.

MEASUREMENT OF MATURITY AND SUGAR CONTENT:

Near infrared analysis provides a fast, safe and easy means to measure cotton maturity, fineness and sugar content at HVI speed without the need for time consuming sample preparation or fiber blending.

This technology is based on the near infrared reflectance spectroscopy principle in the wavelength range of 750 to 2500 nanometers. Differences of maturity in cotton fibers are recognized through distinctly different NIR absorbance spectra. NIR technology also allows for the measurement of sugar content by separating the absorbance characteristics of various sugars from the absorbance of cotton material.

Cotton maturity is the best indicator of potential dyeing problems in cotton products. Immature fibers do not absorb dye as well as mature fibers. This results in a variety of dye-related appearance problems such as barre, reduced color yield, and white specks. Barre is an unwanted striped appearance in fabric, and is often a result of using yarns containing fibres of different maturity levels. For dyed yarn, color yield is diminished when immature fibres are used. White specks are small spots in the yarn or fabric which do not dye at all. These specks are usually attributed to neps (tangled clusters of very immature fibers)

NIR maturity and dye uptake in cotton yarns have been shown to correlate highly with maturity as measured by NIR. A correlation of R=0.96 was obtained for a set of 15 cottons.

In a joint study by ITT and a European research organization, 45 cottons from four continents were tested for maturity using the NIR method and the SHIRLEY Development Fineness/ Maturity tester(FMT). For these samples, NIR and FMT maturity correlated very highly (R=0.94).

On 15 cottons from different growth areas of the USA , NIR maturity was found to correlate with r2 = 0.9 through a method developed by the United States Department of Agriculture (USDA). In this method, fibres are cross-sectioned and microscopically evaluated.

Sugar Content is a valid indicator of potential processing problems. Near infrared analysis, because of its adaptability to HVI, allows for screening of bales prior to use. The information serves to selected bales to avoid preparaion of cotton mixes of bales with excessive sugar content. COTTON STICKINESS consists of two major causes- honeydew form white flies and aphids and high level of natural plant sugars. Both are periodic problems which cause efficiency losses in yarn manufacutring

The problems with the randomly distributed honeydew contamination often results in costly production interruptions and requires immediate action often as severe as discontinuing the use of contaminated cottons.

Natural plant sugars are more evenly distributed and cause problems of residue build-up, lint accumulation and roll laps. Quality problems created by plant sugar stickiness are often more critical in the spinning process than the honeydew stickiness. Lint residues which accumulate on machine parts in various processes will break loose and become part of the fiber mass resulting in yarn imperfections. An effective way to control cotton stickiness in processing is to blend sticky and nonsticky cottons. Knowing the sugar content of each bale of cotton used in each mix minimizes day-to-day variations in processing efficiency and products more consistent yarn quality. Screening the bale inventory for sugar content prior to processing will allow the selection of mixes with good processing characteristics while also utilizing the entire bale inventory.

The relationship between percent sugar content by NIR analysis and the Perkins method shows an excellent correlation of r2=0.95. The amount of reducing material on cotton fiber in the Perkins method is determined by comparing the reducing ability of the water extract of the fiber to that of a standard reducing substance. Using the NIR method, the amount of reducing sugar in cotton is measured.

The popularity of HVI testing has steadily gained since the introduction of the technology in the early 1960s.

Timely, valuable information, promotion of communication, standardisation of measurements, optimization of processes, development of new products and cost control are the outstanding benefits of technology.

Read more...